Final Refusals Fell Every Month of Q2 Even as Examiners Issued More Non-Finals
Something split apart inside the USPTO's examining corps this spring.
 By Howard Katzenberg
Founder, GleanMark
Quarterly USPTO Prosecution Report | USPTO data through June 30, 2026
Something split apart inside the USPTO's examining corps this spring. Non-final office actions climbed to their quarterly high in June — 38,166, up 16.2% from May — while final actions did the opposite, falling in each of the three months from 4,366 in April to 3,383 in June. The quarter's busiest month for first-round refusals was also its quietest for final ones. The rebound everyone will notice in the headline volume number was built entirely on non-final actions.
That divergence is the story of the quarter, and it is worth more than the month-over-month wiggle that usually leads these reports.
When the volume rebounds but the final refusals keep falling, the pipeline is filling faster than it's closing — and every docketing team should be staffing for the front end, not the back.
— Howard Katzenberg, Founder, GleanMark
We think this most likely reflects timing rather than a change in examiner posture: a surge of newly examined applications hitting first action in June, with the corresponding finals still months downstream. If that read is right, the final-action count is the one to watch next quarter.
Executive Summary
- The split: Non-final actions rose to a quarterly high of 38,166 in June, but final actions fell every month — 4,366, then 3,644, then 3,383. The June rebound in total office-action volume came entirely from non-finals.
- Headline volume: The USPTO issued 105,832 non-final and 11,393 final trademark office actions in Q2 2026, for 117,225 office actions total.
- Section 2(d) dominates the analyzed refusals: Likelihood of confusion was the primary refusal in 11,128 of 23,205 analyzed responses — 48.0%, more than the next four categories combined.
- Best-performing argument: Disclaimer arguments led all categories on directional effectiveness at 0.840, ahead of class deletion at 0.802 — but read that alongside the legal issue it actually solves, not as a general win rate.
1. Prosecution Volume
| Period | Non-Final Actions | Final Actions | Total Office Actions | Non-Final MoM Change |
|---|---|---|---|---|
| April 2026 | 34,811 | 4,366 | 39,177 | — |
| May 2026 | 32,855 | 3,644 | 36,499 | -5.6% |
| June 2026 | 38,166 | 3,383 | 41,549 | 16.2% |
| Quarter | Non-Final Actions | Final Actions | Total Office Actions | All Prosecution Documents |
|---|---|---|---|---|
| Q2 2026 | 105,832 | 11,393 | 117,225 | 541,526 |
These are total USPTO figures, not the narrower analyzed subset used for the refusal and argument analysis further down.1
The non-final path was not a climb — it was a dip and a bounce. Volume fell from April to May, then jumped past both prior months in June. Total office actions traced the same V.
Final actions did not. They fell in a straight line across all three months. So the two curves that usually move together came apart: the busiest month for first refusals was the slowest for finals. Read the June number as a front-loading of the examination pipeline, and expect the finals it implies to land in Q3 and Q4.
2. Office Action Document Types
| Document Code | Document Type | Documents in Quarter |
|---|---|---|
| NFIN | Non-Final Action | 105,832 |
| NFO | Notice of Non-Final Office Action | 102,311 |
| ROA | Response to Office Action | 62,931 |
| ABN | ABANDONMENT-Notice | 38,316 |
| AMC | Amendment and Mail Process Complete | 29,619 |
| PB1 | Notice of Publication | 15,470 |
| EB4 | Notification of Notice of Publication | 15,470 |
| PST | TRAM Snapshot of App at Pub for Oppostn | 15,208 |
| PB3 | OG Publication Confirmation | 14,418 |
| ORC | Registration Certificate | 12,320 |
| ERO | Notice of Registration Email | 12,073 |
| FREF | Final Action | 11,393 |
| XSS | XSearch Search Summary | 9,260 |
| ENA | Notice of Allowance | 8,823 |
| SPE | Specimen | 6,699 |
| PNR | Public Note | 6,490 |
One trap to flag: NFIN (Non-Final Action) and NFO (Notice of Non-Final Office Action) are separate codes. Do not add them together when you measure office-action volume — that double-counts nearly every first refusal in the quarter. The rest of the table is a reminder of how much prosecution work happens away from examiner refusals: 62,931 responses, 38,316 abandonment notices, and 12,320 registration certificates all cleared in the same three months.
3. Refusal Landscape
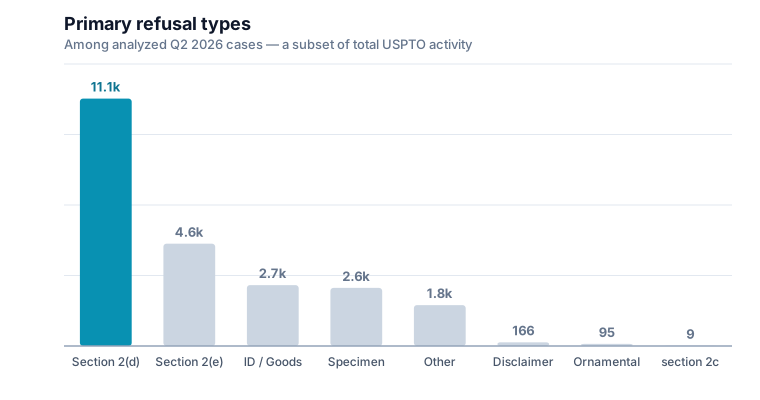
| Primary Refusal Type | Analyzed Responses | Share of Analyzed Responses | Registered to Date |
|---|---|---|---|
| Section 2(d) — Likelihood of Confusion | 11,128 | 48.0% | 4,859 |
| Section 2(e) — Descriptiveness / Surname | 4,602 | 19.8% | 2,167 |
| Identification of Goods/Services | 2,741 | 11.8% | 1,382 |
| Specimen Refusal | 2,615 | 11.3% | 985 |
| Other | 1,838 | 7.9% | 1,101 |
| Disclaimer Requirement | 166 | 0.7% | 97 |
| Ornamental Refusal | 95 | 0.4% | 39 |
| Section 2(c) — Name / Portrait / Signature | 9 | <0.1% | 6 |
| Section 2(a) — Deceptive / False Association | 7 | <0.1% | 2 |
| Failure to Function | 4 | <0.1% | 0 |
| Refusal Type (Overlapping Tag View) | Tagged Analyzed Cases | Tagged Cases Registered to Date |
|---|---|---|
| Section 2(d) — Likelihood of Confusion | 11,128 | 4,859 |
| Identification of Goods/Services | 8,573 | 3,869 |
| Section 2(e) — Descriptiveness / Surname | 8,005 | 3,617 |
| Disclaimer Requirement | 6,580 | 3,282 |
| Specimen Refusal | 5,058 | 1,969 |
| Other | 1,933 | 1,140 |
| Ornamental Refusal | 305 | 125 |
| Section 2(a) — Deceptive / False Association | 49 | 15 |
| Failure to Function | 30 | 10 |
| Section 2(c) — Name / Portrait / Signature | 16 | 9 |
Likelihood of confusion is not just the largest refusal — at 48.0% of analyzed responses, it is bigger than descriptiveness, identification, specimen, and everything in "other" put together. Section 2(e) is a distant second at 19.8%.
The two tables tell different stories, and the gap between them is the useful part. Identification issues are the primary refusal in 2,741 cases but show up as a tag in 8,573 — more than three times as often. Disclaimer requirements are primary in just 166 cases but tagged in 6,580, roughly forty times as often. Read plainly: identification and disclaimer problems rarely stop an application on their own. They ride along with the substantive refusal, and a clean amendment clears them while the real fight is about registrability.
Because the tag counts overlap, they cannot be summed into a quarter-wide refusal total or converted into a share of all USPTO office actions. The primary table is the clean percentage view; the tag table is the co-occurrence view.
4. Argument Effectiveness
| Argument Category | Directional Score (0–1) | Argument Instances |
|---|---|---|
| Disclaimer | 0.840 | 3,296 |
| Class Deletion | 0.802 | 650 |
| Consent Agreement | 0.757 | 467 |
| Supplemental Register | 0.739 | 1,013 |
| Secondary Meaning | 0.731 | 799 |
| Incongruity | 0.719 | 119 |
| Commercial Impression | 0.715 | 1,370 |
| Goods Coexistence | 0.713 | 1,650 |
| Cited Mark Abandoned | 0.709 | 631 |
| Weakness of Cited Mark | 0.700 | 823 |
| Third Party Registrations | 0.697 | 467 |
| Suggestive Not Descriptive | 0.695 | 1,270 |
| Market Channel Distinction | 0.692 | 839 |
| Double Entendre | 0.677 | 50 |
| Specimen Support | 0.672 | 1,780 |
| Refusal Type | Directional Score (0–1) | Argument Instances | Verified-Win Instances |
|---|---|---|---|
| Section 2(d) — Likelihood of Confusion | 0.696 | 11,629 | 2,429 |
| Disclaimer Requirement | 0.778 | 4,027 | 2,076 |
| Specimen Refusal | 0.714 | 2,302 | 700 |
| Identification of Goods/Services | 0.679 | 1,848 | 628 |
| Section 2(e)(1) — Descriptiveness | 0.753 | 1,278 | 371 |
| Other | 0.665 | 536 | 249 |
| Section 2(e)(2) — Geographic Descriptiveness | 0.762 | 137 | 46 |
| Ornamental Refusal | 0.717 | 114 | 54 |
| Section 2(e)(4) — Surname | 0.728 | 100 | 36 |
| Section 2(a) — Deceptive / False Association | 0.697 | 25 | 5 |
| Section 2(e)(5) — Functionality | 0.759 | 14 | 1 |
| Section 2(e)(3) — Geographic Deceptiveness | 0.868 | 12 | 6 |
| Failure to Function | 0.665 | 2 | 0 |
The unit here is argument instances, not cases — one response can raise several. The directional score is a 0–1 signal, not a win rate.
Disclaimer tops the category table at 0.840 across 3,296 instances, with class deletion (0.802) and consent agreements (0.757) behind it. But the score only means something once you match the argument to the refusal it answers. Disclaimers clear descriptiveness or genericness of a component of the mark; they do nothing for likelihood of confusion. Consent and coexistence agreements are the Section 2(d) tools. Supplemental Register is a Section 2(e) play, and only for use-based applications. A high score on the wrong argument is just a high score.
By refusal type, Section 2(d) generates by far the most argument volume — 11,629 instances at a 0.696 score. The eye-catching 0.868 belongs to Section 2(e)(3), geographic deceptiveness, on a grand total of 12 instances. That is a headline waiting to mislead someone. Weight it accordingly.
Practitioner Takeaways
- Staff the front of the pipeline. June was the quarter's high for non-final actions while finals kept falling. If that gap is a timing effect, the response and final-action wave lands next quarter — plan capacity there now.
- Section 2(d) is the whole game. It was the primary refusal in nearly half of analyzed responses. Goods narrowing, market-channel distinctions, and consent agreements are the toolkit; disclaimers and Supplemental Register are not.
- Clear the co-occurring requirements early. Identification and disclaimer issues show up far more often as tags than as primary refusals. A clean amendment removes the procedural drag while you argue the substance.
- Use directional scores for triage, not prediction. A 0–1 score is a signal, not a probability. Discount high scores built on thin samples, especially in narrow refusal types.
Explore more USPTO data analysis on the GleanMark Insights blog.
Footnotes
-
Refusal and argument findings come from GleanMark's analyzed subset — 23,205 analyzed Q2 responses and 12,432 analyzed office actions — against 105,832 total USPTO non-final actions in the quarter. It is not a census of all USPTO refusals. Data sourced from USPTO TSDR and public prosecution records, as recorded through the report date. This report is informational and does not constitute legal advice. ↩
Related Articles
The USPTO Issued More Trademark Office Actions in September 2025 Than in July and August Combined
June 4, 2026
The USPTO Kept Examining Through the Longest Shutdown in History — and Q4's Numbers Show It
June 4, 2026
Trademark Examiners Cleared a Backlog in March: Non-Final Actions Jumped 57% to End Q1 2026
June 4, 2026